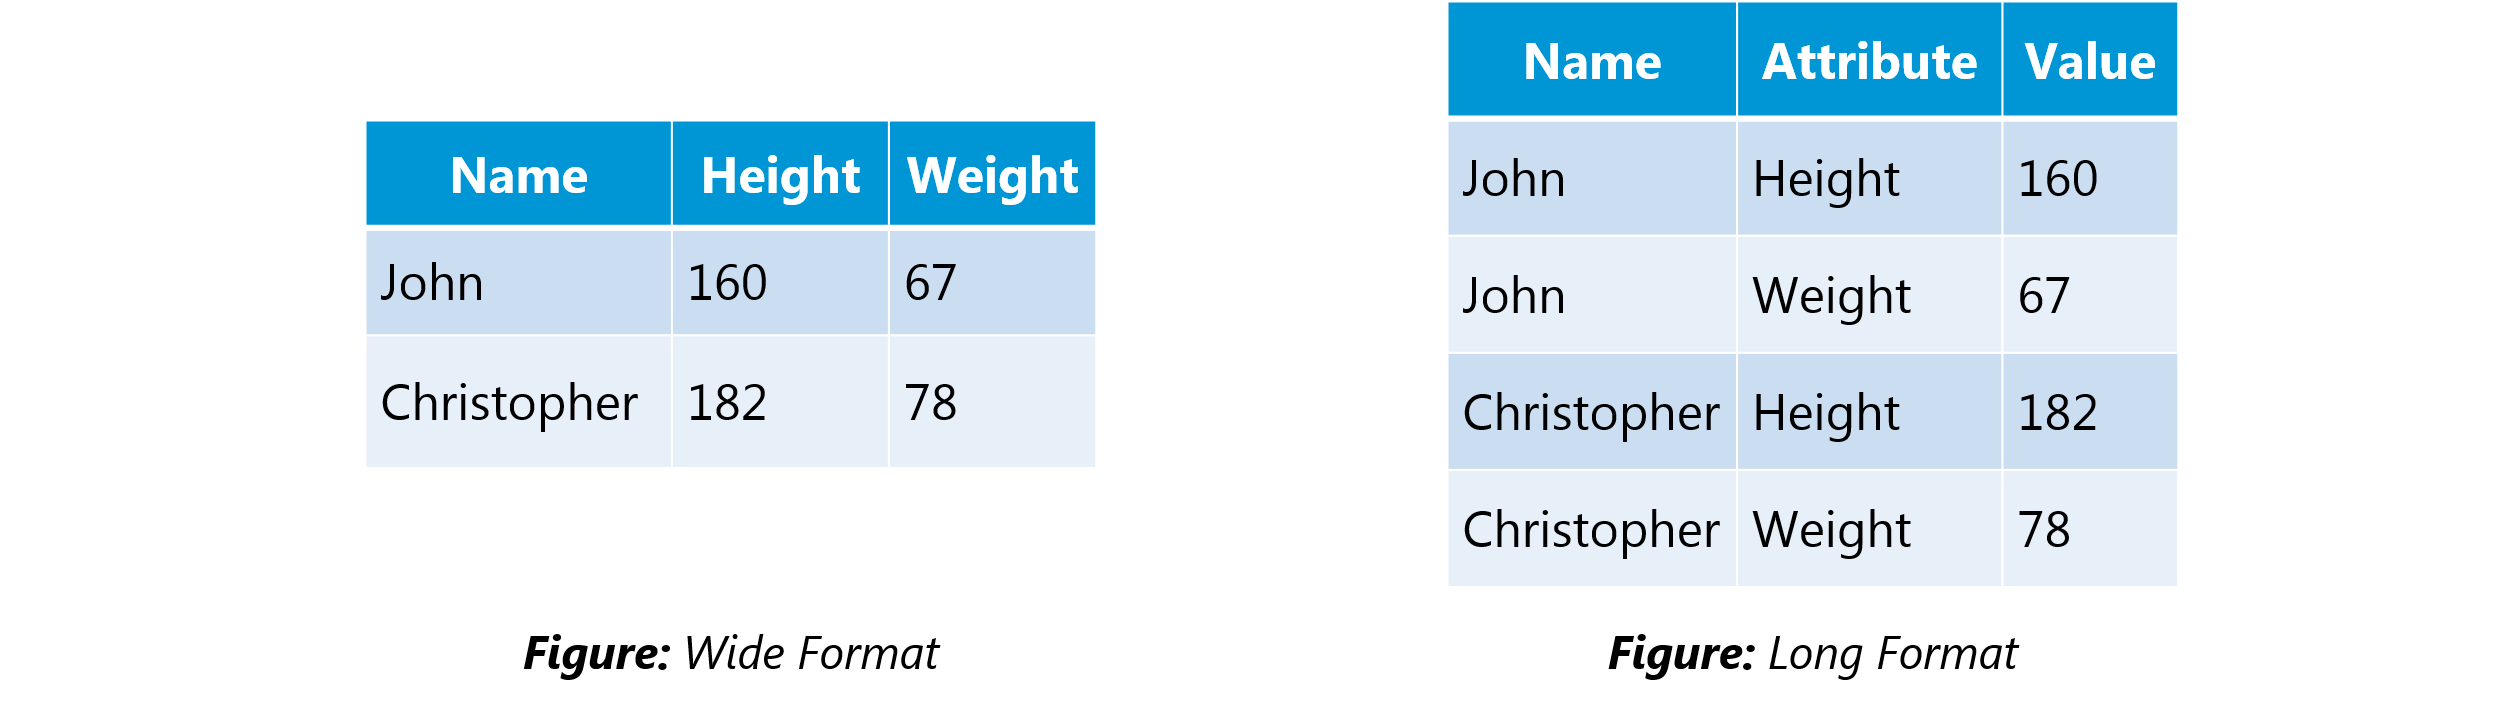
Q1. What is the difference between “long” and “wide” format data?
In the wide-format, a subject’s repeated responses will be in a single row, and each response is in a separate column. In the long-format, each row is a one-time point per subject. You can recognize data in wide format by the fact that columns generally represent groups.
Q2. What do you understand by the term Normal Distribution?
Data is usually distributed in different ways with a bias to the left or to the right or it can all be jumbled up.
However, there are chances that data is distributed around a central value without any bias to the left or right and reaches normal distribution in the form of a bell-shaped curve.
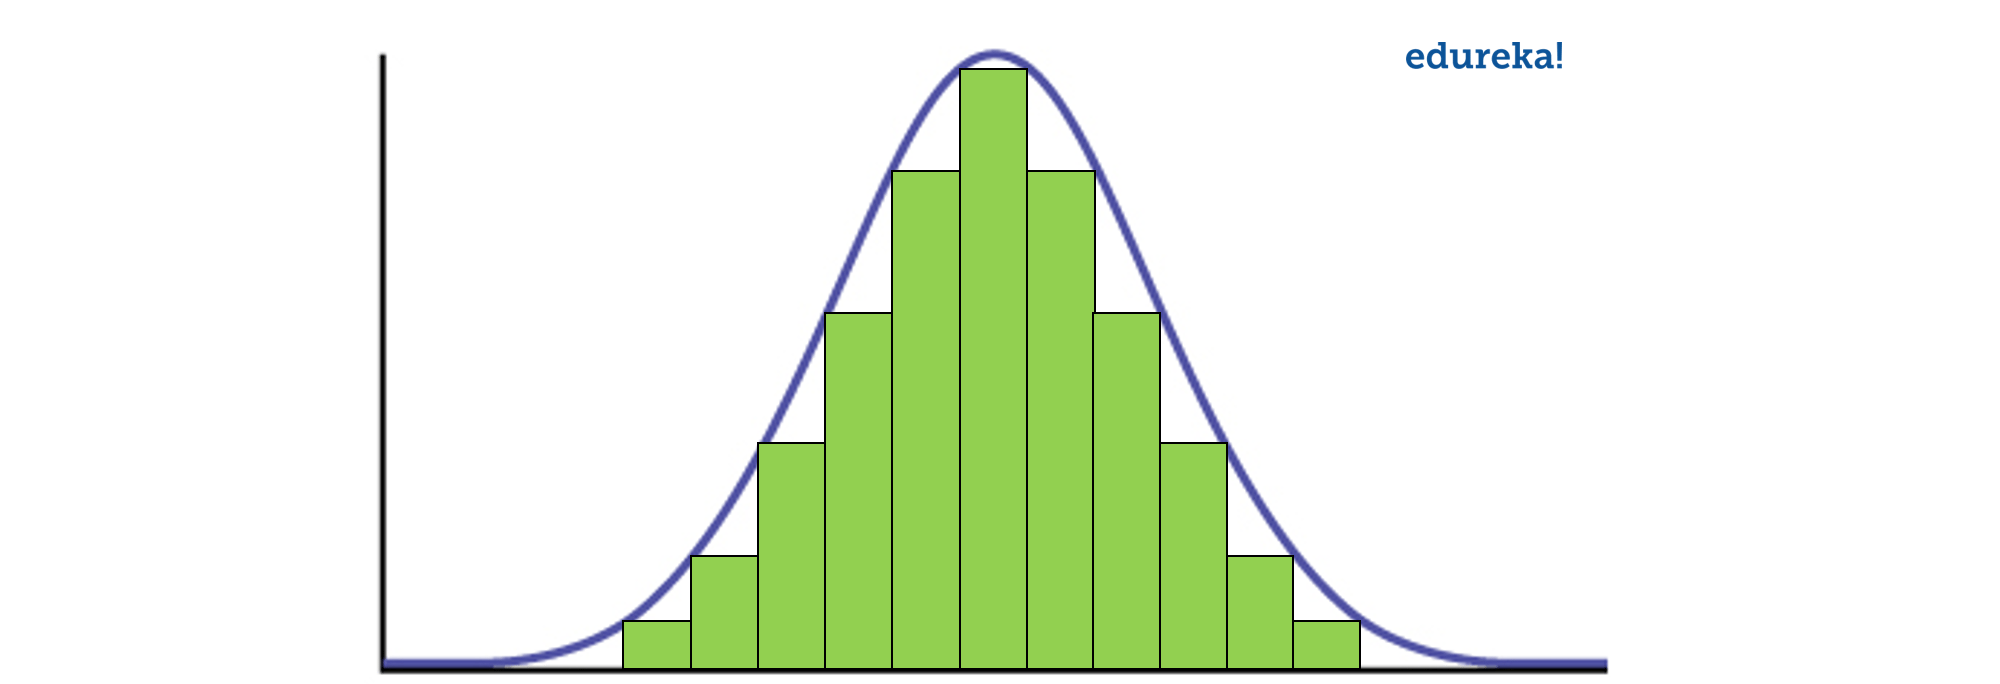
Figure: Normal distribution in a bell curve
The random variables are distributed in the form of a symmetrical, bell-shaped curve.
Properties of Normal Distribution are as follows;
- Unimodal -one mode
- Symmetrical -left and right halves are mirror images
- Bell-shaped -maximum height (mode) at the mean
- Mean, Mode, and Median are all located in the center
- Asymptotic
Q3. What is correlation and covariance in statistics?
Covariance and Correlation are two mathematical concepts; these two approaches are widely used in statistics. Both Correlation and Covariance establish the relationship and also measure the dependency between two random variables. Though the work is similar between these two in mathematical terms, they are different from each other.
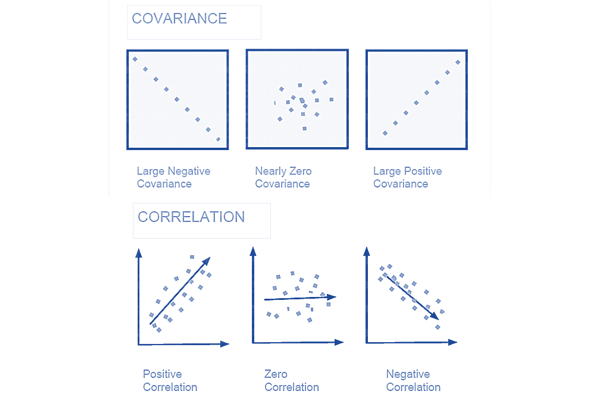 Correlation: Correlation is considered or described as the best technique for measuring and also for estimating the quantitative relationship between two variables. Correlation measures how strongly two variables are related.
Covariance: In covariance two items vary together and it’s a measure that indicates the extent to which two random variables change in cycle. It is a statistical term; it explains the systematic relation between a pair of random variables, wherein changes in one variable reciprocal by a corresponding change in another variable.
Q4. What is the difference between Point Estimates and Confidence Interval?
Point Estimation gives us a particular value as an estimate of a population parameter. Method of Moments and Maximum Likelihood estimator methods are used to derive Point Estimators for population parameters.
A confidence interval gives us a range of values which is likely to contain the population parameter. The confidence interval is generally preferred, as it tells us how likely this interval is to contain the population parameter. This likeliness or probability is called Confidence Level or Confidence coefficient and represented by 1 — alpha, where alpha is the level of significance.
Q5. What is the goal of A/B Testing?
It is a hypothesis testing for a randomized experiment with two variables A and B.
The goal of A/B Testing is to identify any changes to the web page to maximize or increase the outcome of interest. A/B testing is a fantastic method for figuring out the best online promotional and marketing strategies for your business. It can be used to test everything from website copy to sales emails to search ads
An example of this could be identifying the click-through rate for a banner ad.
Q6. What is p-value?
When you perform a hypothesis test in statistics, a p-value can help you determine the strength of your results. p-value is a number between 0 and 1. Based on the value it will denote the strength of the results. The claim which is on trial is called the Null Hypothesis.
Low p-value (≤ 0.05) indicates strength against the null hypothesis which means we can reject the null Hypothesis. High p-value (≥ 0.05) indicates strength for the null hypothesis which means we can accept the null Hypothesis p-value of 0.05 indicates the Hypothesis could go either way. To put it in another way,
High P values: your data are likely with a true null. Low P values: your data are unlikely with a true null.
Q7. In any 15-minute interval, there is a 20% probability that you will see at least one shooting star. What is the probability that you see at least one shooting star in the period of an hour?
Probability of not seeing any shooting star in 15 minutes is
= 1 – P( Seeing one shooting star )
= 1 – 0.2 = 0.8
= 1 – 0.2 = 0.8
Probability of not seeing any shooting star in the period of one hour
= (0.8) ^ 4 = 0.4096
Probability of seeing at least one shooting star in the one hour
= 1 – P( Not seeing any star )
= 1 – 0.4096 = 0.5904
= 1 – 0.4096 = 0.5904
Q8. How can you generate a random number between 1 – 7 with only a die?
- Any die has six sides from 1-6. There is no way to get seven equal outcomes from a single rolling of a die. If we roll the die twice and consider the event of two rolls, we now have 36 different outcomes.
- To get our 7 equal outcomes we have to reduce this 36 to a number divisible by 7. We can thus consider only 35 outcomes and exclude the other one.
- A simple scenario can be to exclude the combination (6,6), i.e., to roll the die again if 6 appears twice.
- All the remaining combinations from (1,1) till (6,5) can be divided into 7 parts of 5 each. This way all the seven sets of outcomes are equally likely.
Q9. A certain couple tells you that they have two children, at least one of which is a girl. What is the probability that they have two girls?
In the case of two children, there are 4 equally likely possibilities
BB, BG, GB and GG;
where B = Boy and G = Girl and the first letter denotes the first child.
From the question, we can exclude the first case of BB. Thus from the remaining 3 possibilities of BG, GB & BB, we have to find the probability of the case with two girls.
Thus, P(Having two girls given one girl) = 1 / 3
Q10. A jar has 1000 coins, of which 999 are fair and 1 is double headed. Pick a coin at random, and toss it 10 times. Given that you see 10 heads, what is the probability that the next toss of that coin is also a head?
There are two ways of choosing the coin. One is to pick a fair coin and the other is to pick the one with two heads.
Probability of selecting fair coin = 999/1000 = 0.999
Probability of selecting unfair coin = 1/1000 = 0.001
Probability of selecting unfair coin = 1/1000 = 0.001
Selecting 10 heads in a row = Selecting fair coin * Getting 10 heads + Selecting an unfair coin
P (A) = 0.999 * (1/2)^5 = 0.999 * (1/1024) = 0.000976
P (B) = 0.001 * 1 = 0.001
P( A / A + B ) = 0.000976 / (0.000976 + 0.001) = 0.4939
P( B / A + B ) = 0.001 / 0.001976 = 0.5061
P (B) = 0.001 * 1 = 0.001
P( A / A + B ) = 0.000976 / (0.000976 + 0.001) = 0.4939
P( B / A + B ) = 0.001 / 0.001976 = 0.5061
Probability of selecting another head = P(A/A+B) * 0.5 + P(B/A+B) * 1 = 0.4939 * 0.5 + 0.5061 = 0.7531
Q11. What do you understand by statistical power of sensitivity and how do you calculate it?
Sensitivity is commonly used to validate the accuracy of a classifier (Logistic, SVM, Random Forest etc.).
Sensitivity is nothing but “Predicted True events/ Total events”. True events here are the events which were true and model also predicted them as true.
Calculation of seasonality is pretty straightforward.
Seasonality = ( True Positives ) / ( Positives in Actual Dependent Variable )
Q12. Why Is Re-sampling Done?
Resampling is done in any of these cases:
- Estimating the accuracy of sample statistics by using subsets of accessible data or drawing randomly with replacement from a set of data points
- Substituting labels on data points when performing significance tests
- Validating models by using random subsets (bootstrapping, cross-validation)
Q13. What are the differences between over-fitting and under-fitting?
In statistics and machine learning, one of the most common tasks is to fit a model to a set of training data, so as to be able to make reliable predictions on general untrained data.
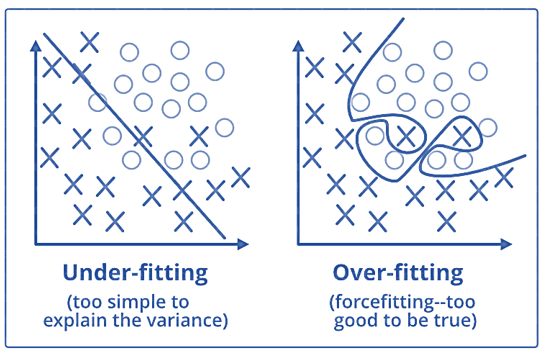
In overfitting, a statistical model describes random error or noise instead of the underlying relationship. Overfitting occurs when a model is excessively complex, such as having too many parameters relative to the number of observations. A model that has been overfitted, has poor predictive performance, as it overreacts to minor fluctuations in the training data.
Underfitting occurs when a statistical model or machine learning algorithm cannot capture the underlying trend of the data. Underfitting would occur, for example, when fitting a linear model to non-linear data. Such a model too would have poor predictive performance.
Q14. How to combat Overfitting and Underfitting?
To combat overfitting and underfitting, you can resample the data to estimate the model accuracy (k-fold cross-validation) and by having a validation dataset to evaluate the model.
Q15. What is regularisation? Why is it useful?
Regularisation is the process of adding tuning parameter to a model to induce smoothness in order to prevent overfitting. This is most often done by adding a constant multiple to an existing weight vector. This constant is often the L1(Lasso) or L2(ridge). The model predictions should then minimize the loss function calculated on the regularized training set.
Q16. What Is the Law of Large Numbers?
It is a theorem that describes the result of performing the same experiment a large number of times. This theorem forms the basis of frequency-style thinking. It says that the sample means, the sample variance and the sample standard deviation converge to what they are trying to estimate.
Q17. What Are Confounding Variables?
In statistics, a confounder is a variable that influences both the dependent variable and independent variable.
For example, if you are researching whether a lack of exercise leads to weight gain,
lack of exercise = independent variable
weight gain = dependent variable.
A confounding variable here would be any other variable that affects both of these variables, such as the age of the subject.
Q18. What Are the Types of Biases That Can Occur During Sampling?
- Selection bias
- Under coverage bias
- Survivorship bias
Q19. What is Survivorship Bias?
It is the logical error of focusing aspects that support surviving some process and casually overlooking those that did not work because of their lack of prominence. This can lead to wrong conclusions in numerous different means.
Q20. What is selection Bias?
Selection bias occurs when the sample obtained is not representative of the population intended to be analysed.
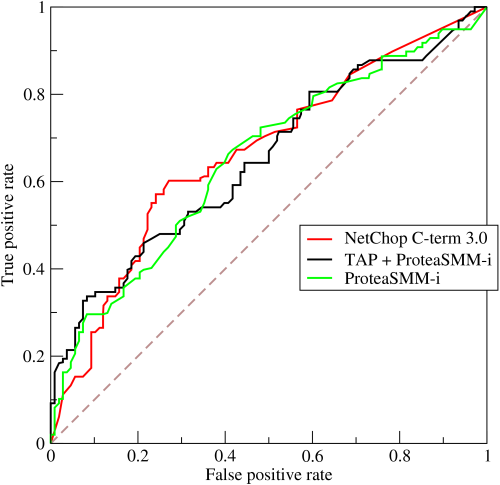
Q21. Explain how a ROC curve works?
The ROC curve is a graphical representation of the contrast between true positive rates and false-positive rates at various thresholds. It is often used as a proxy for the trade-off between the sensitivity(true positive rate) and false-positive rate.
Q22. What is TF/IDF vectorization?
TF–IDF is short for term frequency-inverse document frequency, is a numerical statistic that is intended to reflect how important a word is to a document in a collection or corpus. It is often used as a weighting factor in information retrieval and text mining.
The TF–IDF value increases proportionally to the number of times a word appears in the document but is offset by the frequency of the word in the corpus, which helps to adjust for the fact that some words appear more frequently in general.
Q23. Why we generally use Softmax non-linearity function as last operation in-network?
It is because it takes in a vector of real numbers and returns a probability distribution. Its definition is as follows. Let x be a vector of real numbers (positive, negative, whatever, there are no constraints).
Then the i’th component of Softmax(x) is —
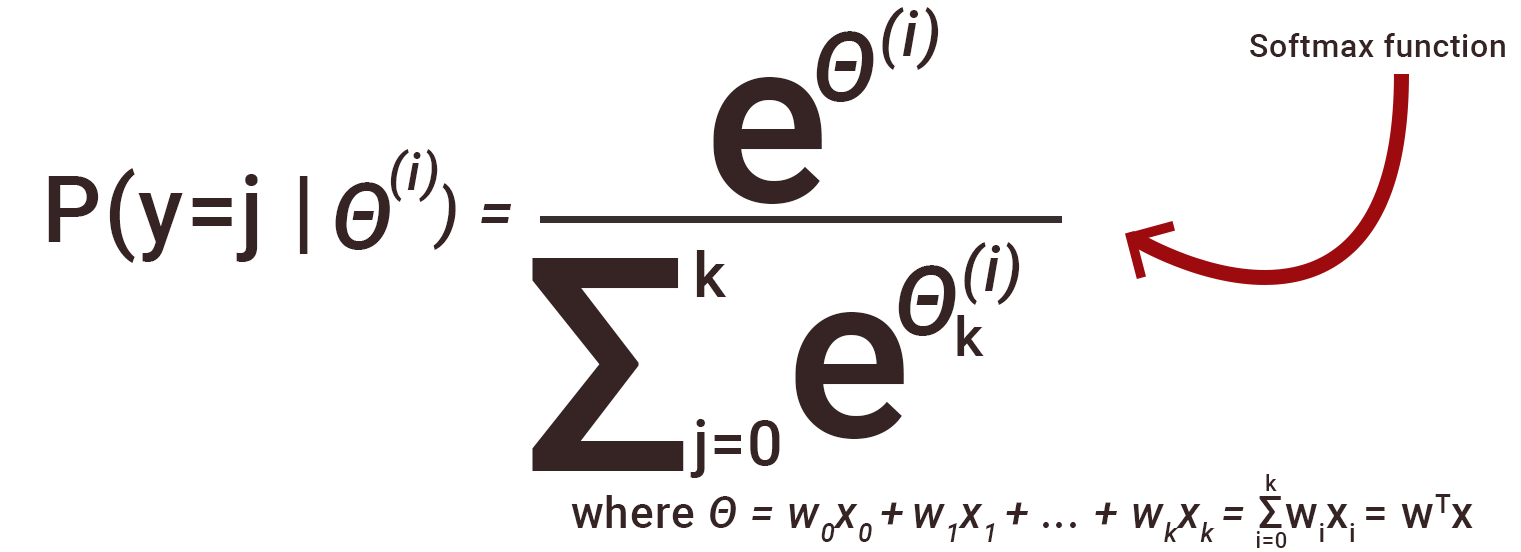
It should be clear that the output is a probability distribution: each element is non-negative and the sum over all components is 1.
Reference : Thanks to Edureka for an awesome collection
Reference : Thanks to Edureka for an awesome collection
Comments
Post a Comment