
CondaValueError: Value error: invalid package specification

Recently I was trying to create Conda Environment and wanted to install Tensorflow but i have faced some issue , so i have done some research and done trouble shooting related to that . Here am going to share how to trouble shoot if you are getting Conda Value error while creating Conda environment and install tensorflow
.


  1. Open Anaconda Prompt (as administrator if it was installed for all users)
  2. Run conda update conda
  3. Run the installer again
Make sure all pkg are updated:


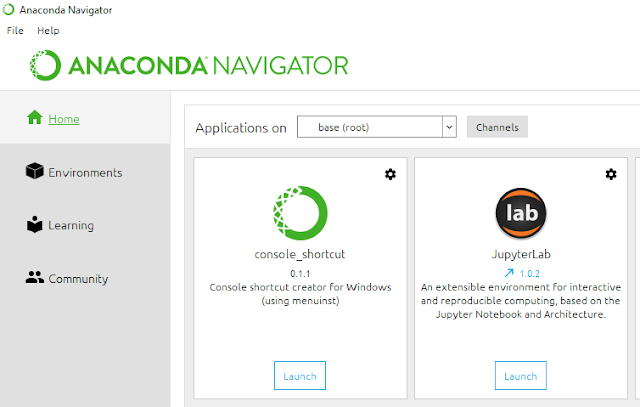
Launch the console from Anaconda Navigator and
conda create -n mypython python=3.6.8

After Installing Conda environment please active the conda now : conda activate mypython
once conda environment has been activated kindly install tensorflow 2.0 by using this command pip install tensorflow==2.0.0


once Tensorflow has been successfully install kindly run the command : pip show tensorflow
Try to Run Comman PIP Install Jupyter lab and after installing launch the console and open Jupyter notebook
Happy Learning...!!

Comments

  1. Thanks Anand its really help and guide me solve very similar issue.

    ReplyDelete

Post a Comment

Popular posts from this blog

Introduction to Datascience

Data Science has become one of the most demanded jobs of the 21st century. What is Data Science? “Data Science is about extraction, preparation, analysis, visualization, and maintenance of information. It is a cross-disciplinary field which uses scientific methods and processes to draw insights from data. ” As a data scientist, you take a complex business problem, compile research from it, creating it into data, then use that data to solve the problem. A Data Scientist, specializing in Data Science, not only analyzes the data but also uses machine learning algorithms to predict future occurrences of an event. Therefore, we can understand Data Science as a field that deals with data processing, analysis, and extraction of insights from the data using various statistical methods and computer algorithms. It is a multidisciplinary field that combines mathematics, statistics, and computer science. Why Data Science? So, after knowing what exactly Data Science is, you must explore ...

What is P Value ?

In Data Science interviews, one of the frequently asked questions is ‘What is P-Value?”. According to American Statistical Association, “A p-value is the probability under a specified statistical model that a statistical summary of the data (e.g., the sample mean difference between two compared groups) would be equal to or more extreme than its observed value.”  That’s hard to grasp, yes? Alright, lets understand what really is p value in small meaningful pieces to make it very clear. When and how is p-value used? To understand p-value, you need to understand some background and context behind it. So, let’s start with the basics. p-values are often reported whenever you perform a statistical significance test (like t-test, chi-square test etc). These tests typically return a computed test statistic and the associated p-value. This reported value is used to establish the statistical significance of the relationships being tested. So, whenever you see a p-valu...

Data Science Interview Questions -Part 2

1) What are the differences between supervised and unsupervised learning? Supervised Learning Unsupervised Learning Uses known and labeled data as input Supervised learning has a feedback mechanism  Most commonly used supervised learning algorithms are decision trees, logistic regression, and support vector machine Uses unlabeled data as input Unsupervised learning has no feedback mechanism  Most commonly used unsupervised learning algorithms are k-means clustering, hierarchical clustering, and apriori algorithm 2) How is logistic regression done? Logistic regression measures the relationship between the dependent variable (our label of what we want to predict) and one or more independent variables (our features) by estimating probability using its underlying logistic function (sigmoid). The image shown below depicts how logistic regression works: The formula and graph for the sigmoid function is as shown: 3) Explain the steps in making a deci...