
15 Common questions for Machine Learning...!!

 1. What is logistic regression?

Logistic regression is a machine learning algorithm for classification. In this algorithm, the probabilities describing the possible outcomes of a single trial are modelled using a logistic function.

2. What is the syntax for logistic regression?

Library: sklearn.linear_model.LogisticRegression

Define model: lr = LogisticRegression()

Fit model: model = lr.fit(x, y)

Predictions: pred = model.predict_proba(test)

3. How do you split the data in train / test?

Library: sklearn.model_selection.train_test_split

Syntax: X_train, X_test, y_train, y_test = train_test_split(X, y, test_size=0.33, random_state=42)

4. What is decision tree?

Given a data of attributes together with its classes, a decision tree produces a sequence of rules that can be used to classify the data.

5. What is the syntax for decision tree classifier?

Library: sklearn.tree.DecisionTreeClassifier
Define model: dtc = DecisionTreeClassifier()
Fit model: model = dtc.fit(x, y)
Predictions: pred = model.predict_proba(test)

6. What is random forest?

Random forest classifier is a meta-estimator that fits a number of decision trees on various sub-samples of datasets and uses average to improve the predictive accuracy of the model and controls over-fitting. The sub-sample size is always the same as the original input sample size but the samples are drawn with replacement.

7. What is the syntax for random forest classifier?

Library: sklearn.ensemble.RandomForestClassifier
Define model: rfc = RandomForestClassifier()
Fit model: model = rfc.fit(x, y)
Predictions: pred = model.predict_proba(test)

8. What is gradient boosting?

Gradient boosting is a machine learning technique for regression and classification problems, which produces a prediction model in the form of an ensemble of weak prediction models, typically decision trees. It builds the model in a stage-wise fashion like other boosting methods do, and it generalizes them by allowing optimization of an arbitrary differentiable loss function.

9. What is the syntax for gradient boosting classifier?

Library: sklearn.ensemble.GradientBoostingClassifier
Define model: gbc = GradientBoostingClassifier()
Fit model: model = gbc.fit(x, y)
Predictions: pred = model.predict_proba(test)

10. What is SVM?

Support vector machine is a representation of the training data as points in space separated into categories by a clear gap that is as wide as possible. New examples are then mapped into that same space and predicted to belong to a category based on which side of the gap they fall.

11. What is the difference between KNN and KMeans?

KNN:

Supervised classification algorithm
Classifies new data points accordingly to the k number or the closest data points

KMeans:

Unsupervised clustering algorithm

Groups data into k number of clusters.

12. How do you treat missing values?

Drop rows having missing values

DataFrame.dropna(axis=0, how=’any’, inplace=True)

Drop columns

DataFrame.dropna(axis=1, how=’any’, inplace=True)

Replace missing values with zero / mean

df[‘income’].fillna(0)
df[‘income’] = df[‘income’].fillna((df[‘income’].mean()))

13. How do you treat outliers?

Inter quartile range is used to identify the outliers.
Q1 = df[‘income’].quantile(0.25)
Q3 = df[‘income’].quantile(0.75)
IQR = Q3 — Q1
df = df[(df[‘income’] >= (Q1–1.5 * IQR)) & (df[‘income’] <= (Q3 + 1.5 * IQR))]

14. What is bias / variance trade off?

Definition

The Bias-Variance Trade off is relevant for supervised machine learning, specifically for predictive modelling. It’s a way to diagnose the performance of an algorithm by breaking down its prediction error.

Error from Bias

Bias is the difference between your model’s expected predictions and the true values.

This is known as under-fitting.

Does not improve with collecting more data points.

Error from Variance

Variance refers to your algorithm’s sensitivity to specific sets of training data.
This is known as over-fitting.
Improves with collecting more data points.

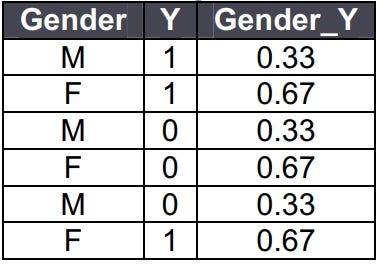
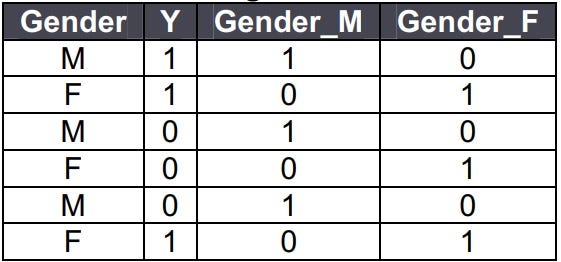
15. How do you treat categorical variables?

Replace categorical variables with the average of target for each category

Image for post
Image for post
by applying one hot encoding we can treat Categorical variable..!!

Comments

Popular posts from this blog

Data is the New oil of Industry?

Let's go back to 18th century ,when development was taking its first footstep.The time when oil was considered to be the subset of industrial revolution. Oil than tends to be the most valuable asset in those time. Now let's come back in present. In 21st century, data is vigorously called the foundation of information revolution. But the question that arises is why are we really calling data as the new oil. Well for it's explanation Now we are going to compare Data Vs Oil Data is an essential resource that powers the information economy in much the way that oil has fueled the industrial economy. Once upon a time, the wealthiest were those with most natural resources, now it’s knowledge economy, where the more you know is proportional to more data that you have. Information can be extracted from data just as energy can be extracted from oil. Traditional Oil powered the transportation era, in the same way that Data as the new oil is also powering the emerging transportation op...

Important Python Libraries for Data Science

Python is the most widely used programming language today. When it comes to solving data science tasks and challenges, Python never ceases to surprise its users. Most data scientists are already leveraging the power of Python programming every day. Python is an easy-to-learn, easy-to-debug, widely used, object-oriented, open-source, high-performance language, and there are many more benefits to Python programming.People in Data Science definitely know about the Python libraries that can be used in Data Science but when asked in an interview to name them or state its function, we often fumble up or probably not remember more than 5 libraries. Important Python Libraries for Data Science: Pandas NumPy SciPy Matplotlib TensorFlow Seaborn Scikit Learn Keras 1. Pandas Pandas (Python data analysis) is a must in the data science life cycle. It is the most popular and widely used Python library for data science, along with NumPy in matplotlib. With around 17,00 comments on GitH...

Differentiate between univariate, bivariate and multivariate analysis.

Univariate analysis are descriptive statistical analysis techniques which can be differentiated based on one variable involved at a given point of time. For example, the pie charts of sales based on territory involve only one variable and can the analysis can be referred to as univariate analysis. The bivariate analysis attempts to understand the difference between two variables at a time as in a scatterplot. For example, analyzing the volume of sale and spending can be considered as an example of bivariate analysis. Multivariate analysis deals with the study of more than two variables to understand the effect of variables on the responses.