Q1. What is Data Science? List the differences between supervised and unsupervised learning.
Data Science is a blend of various tools, algorithms, and machine learning principles with the goal to discover hidden patterns from the raw data. How is this different from what statisticians have been doing for years?
The answer lies in the difference between explaining and predicting.
The differences between supervised and unsupervised learning are as follows;
Supervised Learning
|
Unsupervised Learning
|
Input data is labelled.
|
Input data is unlabelled.
|
Uses a training data set.
|
Uses the input data set.
|
Used for prediction.
|
Used for analysis.
|
Enables classification and regression.
|
Enables Classification, Density Estimation, & Dimension Reduction
|
Q2. What is Selection Bias?
Selection bias is a kind of error that occurs when the researcher decides who is going to be studied. It is usually associated with research where the selection of participants isn’t random. It is sometimes referred to as the selection effect. It is the distortion of statistical analysis, resulting from the method of collecting samples. If the selection bias is not taken into account, then some conclusions of the study may not be accurate.
The types of selection bias include:
- Sampling bias: It is a systematic error due to a non-random sample of a population causing some members of the population to be less likely to be included than others resulting in a biased sample.
- Time interval: A trial may be terminated early at an extreme value (often for ethical reasons), but the extreme value is likely to be reached by the variable with the largest variance, even if all variables have a similar mean.
- Data: When specific subsets of data are chosen to support a conclusion or rejection of bad data on arbitrary grounds, instead of according to previously stated or generally agreed criteria.
- Attrition: Attrition bias is a kind of selection bias caused by attrition (loss of participants) discounting trial subjects/tests that did not run to completion.
Q3. What is bias-variance trade-off?
Bias: Bias is an error introduced in your model due to oversimplification of the machine learning algorithm. It can lead to underfitting. When you train your model at that time model makes simplified assumptions to make the target function easier to understand.
Low bias machine learning algorithms — Decision Trees, k-NN and SVM High bias machine learning algorithms — Linear Regression, Logistic Regression
Variance: Variance is error introduced in your model due to complex machine learning algorithm, your model learns noise also from the training data set and performs badly on test data set. It can lead to high sensitivity and overfitting.
Normally, as you increase the complexity of your model, you will see a reduction in error due to lower bias in the model. However, this only happens until a particular point. As you continue to make your model more complex, you end up over-fitting your model and hence your model will start suffering from high variance.
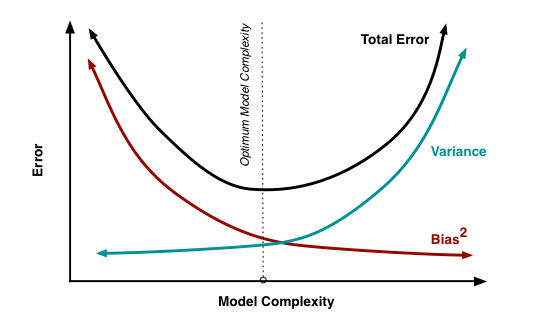
Bias-Variance trade-off: The goal of any supervised machine learning algorithm is to have low bias and low variance to achieve good prediction performance.
- The k-nearest neighbour algorithm has low bias and high variance, but the trade-off can be changed by increasing the value of k which increases the number of neighbours that contribute to the prediction and in turn increases the bias of the model.
- The support vector machine algorithm has low bias and high variance, but the trade-off can be changed by increasing the C parameter that influences the number of violations of the margin allowed in the training data which increases the bias but decreases the variance.
There is no escaping the relationship between bias and variance in machine learning. Increasing the bias will decrease the variance. Increasing the variance will decrease bias.
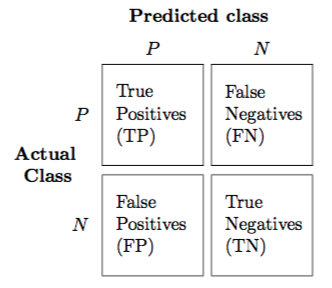
Q4. What is a confusion matrix?
The confusion matrix is a 2X2 table that contains 4 outputs provided by the binary classifier. Various measures, such as error-rate, accuracy, specificity, sensitivity, precision and recall are derived from it. Confusion Matrix
A data set used for performance evaluation is called a test data set. It should contain the correct labels and predicted labels.
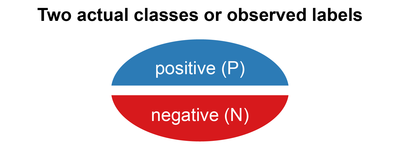
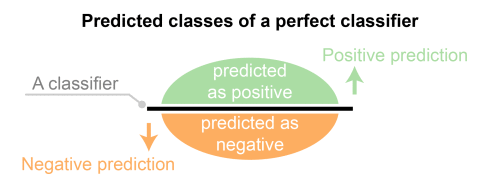
The predicted labels will exactly the same if the performance of a binary classifier is perfect.
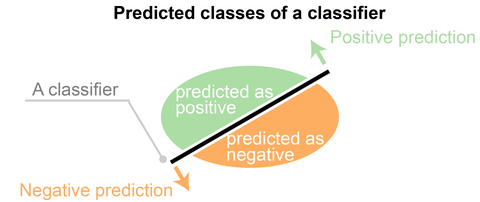
The predicted labels usually match with part of the observed labels in real-world scenarios.
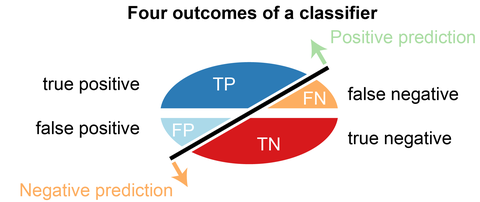
A binary classifier predicts all data instances of a test data set as either positive or negative. This produces four outcomes-
- True-positive(TP) — Correct positive prediction
- False-positive(FP) — Incorrect positive prediction
- True-negative(TN) — Correct negative prediction
- False-negative(FN) — Incorrect negative prediction
Basic measures derived from the confusion matrix
- Error Rate = (FP+FN)/(P+N)
- Accuracy = (TP+TN)/(P+N)
- Sensitivity(Recall or True positive rate) = TP/P
- Specificity(True negative rate) = TN/N
- Precision(Positive predicted value) = TP/(TP+FP)
- F-Score(Harmonic mean of precision and recall) = (1+b)(PREC.REC)/(b²PREC+REC) where b is commonly 0.5, 1, 2.
Reference : Thanks to Edureka for an awesome collection
Comments
Post a Comment