Q1. What is Machine Learning?
Machine Learning explores the study and construction of algorithms that can learn from and make predictions on data. Closely related to computational statistics. Used to devise complex models and algorithms that lend themselves to a prediction which in commercial use is known as predictive analytics. Given below, is an image representing the various domains Machine Learning lends itself to.
Q2. What is Supervised Learning?
Supervised learning is the machine learning task of inferring a function from labeled training data. The training data consist of a set of training examples.
Algorithms: Support Vector Machines, Regression, Naive Bayes, Decision Trees, K-nearest Neighbor Algorithm and Neural Networks
E.g. If you built a fruit classifier, the labels will be “this is an orange, this is an apple and this is a banana”, based on showing the classifier examples of apples, oranges and bananas.
Q3. What is Unsupervised learning?
Unsupervised learning is a type of machine learning algorithm used to draw inferences from datasets consisting of input data without labelled responses.
Algorithms: Clustering, Anomaly Detection, Neural Networks and Latent Variable Models
E.g. In the same example, a fruit clustering will categorize as “fruits with soft skin and lots of dimples”, “fruits with shiny hard skin” and “elongated yellow fruits”.
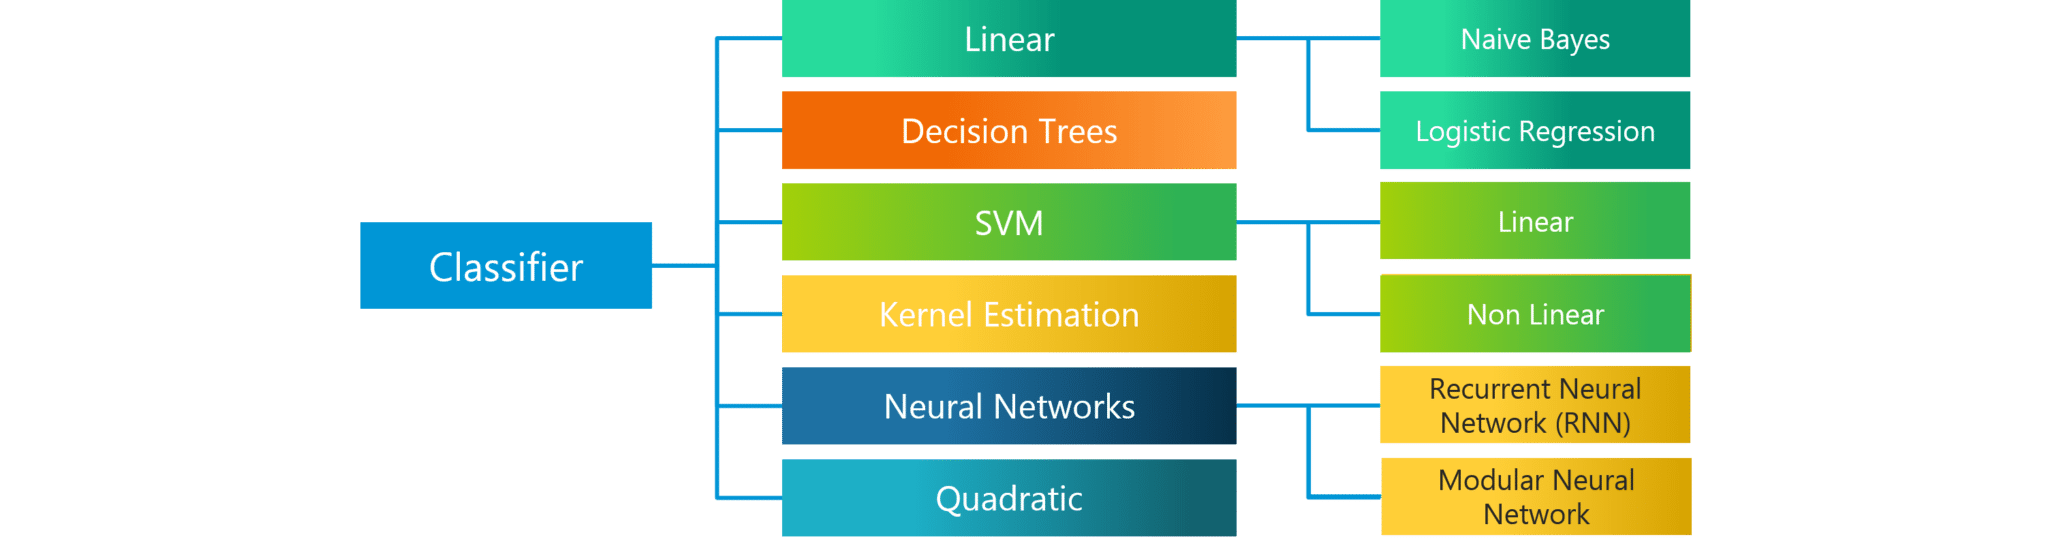
Q4. What are the various classification algorithms?
The diagram lists the most important classification algorithms.
Q5. What is ‘Naive’ in a Naive Bayes?
The Naive Bayes Algorithm is based on the Bayes Theorem. Bayes’ theorem describes the probability of an event, based on prior knowledge of conditions that might be related to the event.
The Algorithm is ‘naive’ because it makes assumptions that may or may not turn out to be correct.
Q6. Explain SVM algorithm in detail.
SVM stands for support vector machine, it is a supervised machine learning algorithm which can be used for both Regression and Classification. If you have n features in your training data set, SVM tries to plot it in n-dimensional space with the value of each feature being the value of a particular coordinate. SVM uses hyperplanes to separate out different classes based on the provided kernel function.
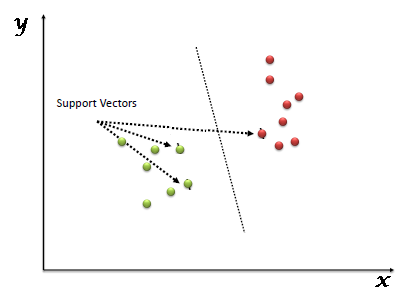
Q7. What are the support vectors in SVM?
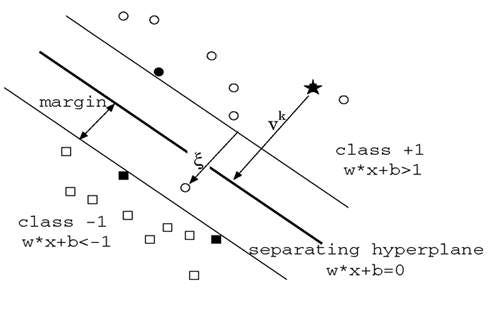
In the diagram, we see that the thinner lines mark the distance from the classifier to the closest data points called the support vectors (darkened data points). The distance between the two thin lines is called the margin.
Q8. What are the different kernels in SVM?
There are four types of kernels in SVM.
- Linear Kernel
- Polynomial kernel
- Radial basis kernel
- Sigmoid kernel
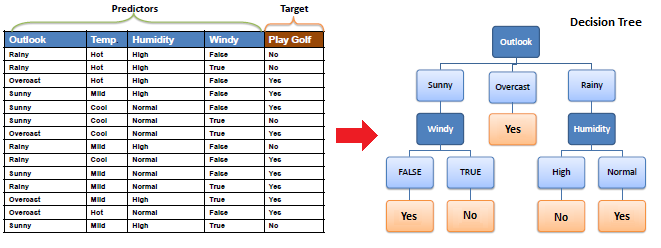
Q9. Explain Decision Tree algorithm in detail.
A decision tree is a supervised machine learning algorithm mainly used for Regression and Classification. It breaks down a data set into smaller and smaller subsets while at the same time an associated decision tree is incrementally developed. The final result is a tree with decision nodes and leaf nodes. A decision tree can handle both categorical and numerical data.
Q10. What are Entropy and Information gain in Decision tree algorithm?
The core algorithm for building a decision tree is called ID3. ID3 uses Entropy and Information Gain to construct a decision tree.
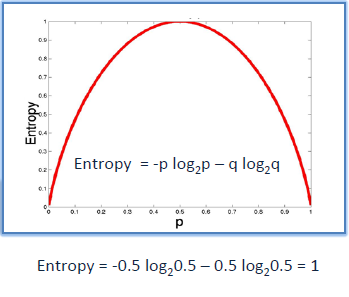
Entropy
A decision tree is built top-down from a root node and involve partitioning of data into homogenious subsets. ID3 uses enteropy to check the homogeneity of a sample. If the sample is completely homogenious then entropy is zero and if the sample is an equally divided it has entropy of one.
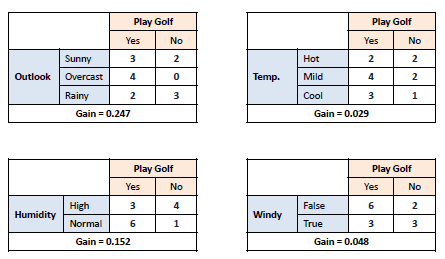
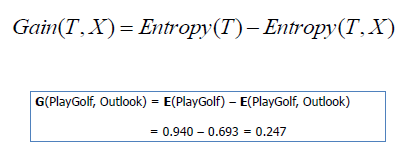
Information Gain
The Information Gain is based on the decrease in entropy after a dataset is split on an attribute. Constructing a decision tree is all about finding attributes that return the highest information gain.
Q11. What is pruning in Decision Tree?
Pruning is a technique in machine learning and search algorithms that reduces the size of decision trees by removing sections of the tree that provide little power to classify instances. So, when we remove sub-nodes of a decision node, this process is called pruning or opposite process of splitting.
Q12. What is logistic regression? State an example when you have used logistic regression recently.
Logistic Regression often referred to as the logit model is a technique to predict the binary outcome from a linear combination of predictor variables.
For example, if you want to predict whether a particular political leader will win the election or not. In this case, the outcome of prediction is binary i.e. 0 or 1 (Win/Lose). The predictor variables here would be the amount of money spent for election campaigning of a particular candidate, the amount of time spent in campaigning, etc.
Q13. What is Linear Regression?
Linear regression is a statistical technique where the score of a variable Y is predicted from the score of a second variable X. X is referred to as the predictor variable and Y as the criterion variable.
Q14. What Are the Drawbacks of the Linear Model?
Some drawbacks of the linear model are:
- The assumption of linearity of the errors.
- It can’t be used for count outcomes or binary outcomes
- There are overfitting problems that it can’t solve
Q15. What is the difference between Regression and classification ML techniques?
Both Regression and classification machine learning techniques come under Supervised machine learning algorithms. In Supervised machine learning algorithm, we have to train the model using labelled data set, While training we have to explicitly provide the correct labels and algorithm tries to learn the pattern from input to output. If our labels are discrete values then it will a classification problem, e.g A,B etc. but if our labels are continuous values then it will be a regression problem, e.g 1.23, 1.333 etc.
Q16. What are Recommender Systems?
Recommender Systems are a subclass of information filtering systems that are meant to predict the preferences or ratings that a user would give to a product. Recommender systems are widely used in movies, news, research articles, products, social tags, music, etc.
Examples include movie recommenders in IMDB, Netflix & BookMyShow, product recommenders in e-commerce sites like Amazon, eBay & Flipkart, YouTube video recommendations and game recommendations in Xbox.
Q17. What is Collaborative filtering?
The process of filtering used by most of the recommender systems to find patterns or information by collaborating viewpoints, various data sources and multiple agents.
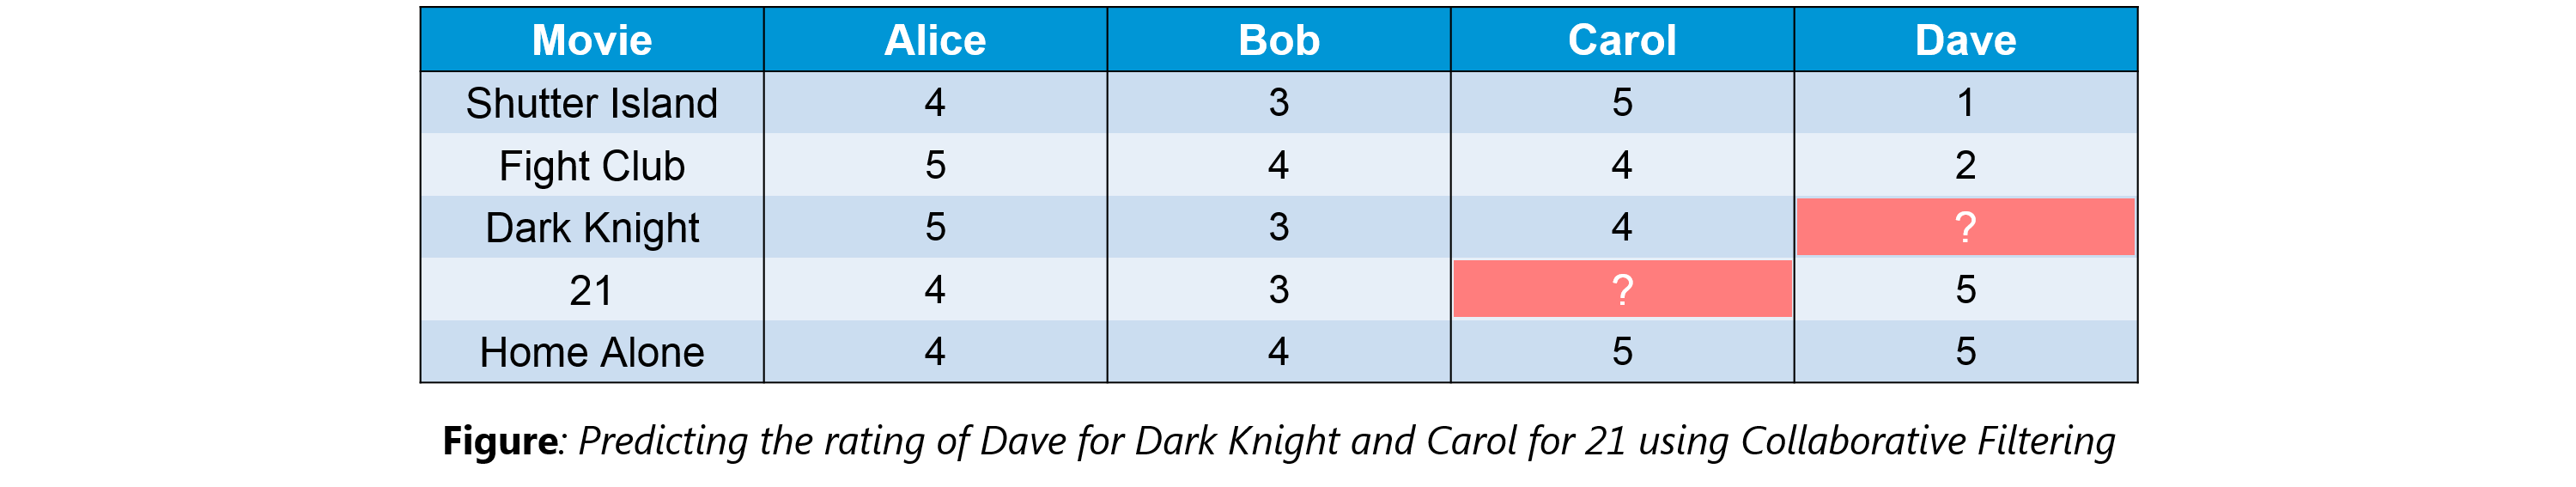
An example of collaborative filtering can be to predict the rating of a particular user based on his/her ratings for other movies and others’ ratings for all movies. This concept is widely used in recommending movies in IMDB, Netflix & BookMyShow, product recommenders in e-commerce sites like Amazon, eBay & Flipkart, YouTube video recommendations and game recommendations in Xbox.
Q18. How can outlier values be treated?
Outlier values can be identified by using univariate or any other graphical analysis method. If the number of outlier values is few then they can be assessed individually but for a large number of outliers, the values can be substituted with either the 99th or the 1st percentile values.
All extreme values are not outlier values. The most common ways to treat outlier values
- To change the value and bring it within a range.
- To just remove the value.
Q19. What are the various steps involved in an analytics project?
The following are the various steps involved in an analytics project:
- Understand the Business problem
- Explore the data and become familiar with it.
- Prepare the data for modelling by detecting outliers, treating missing values, transforming variables, etc.
- After data preparation, start running the model, analyze the result and tweak the approach. This is an iterative step until the best possible outcome is achieved.
- Validate the model using a new data set.
- Start implementing the model and track the result to analyze the performance of the model over the period of time.
Q20. During analysis, how do you treat missing values?
The extent of the missing values is identified after identifying the variables with missing values. If any patterns are identified the analyst has to concentrate on them as it could lead to interesting and meaningful business insights.
If there are no patterns identified, then the missing values can be substituted with mean or median values (imputation) or they can simply be ignored. Assigning a default value which can be mean, minimum or maximum value. Getting into the data is important.
If it is a categorical variable, the default value is assigned. The missing value is assigned a default value. If you have a distribution of data coming, for normal distribution give the mean value.
If 80% of the values for a variable are missing then you can answer that you would be dropping the variable instead of treating the missing values.
Q21. How will you define the number of clusters in a clustering algorithm?
Though the Clustering Algorithm is not specified, this question is mostly in reference to K-Means clustering where “K” defines the number of clusters. The objective of clustering is to group similar entities in a way that the entities within a group are similar to each other but the groups are different from each other.
For example, the following image shows three different groups.
 Within Sum of squares is generally used to explain the homogeneity within a cluster. If you plot WSS for a range of number of clusters, you will get the plot shown below.
- The Graph is generally known as Elbow Curve.
- Red circled a point in above graph i.e. Number of Cluster =6 is the point after which you don’t see any decrement in WSS.
- This point is known as the bending point and taken as K in K – Means.
This is the widely used approach but few data scientists also use Hierarchical clustering first to create dendrograms and identify the distinct groups from there.
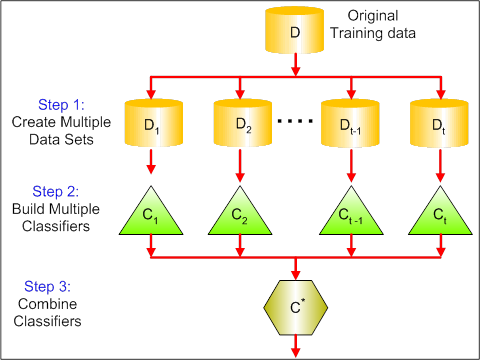
Q22. What is Ensemble Learning?
Ensemble Learning is basically combining a diverse set of learners(Individual models) together to improvise on the stability and predictive power of the model.
Q23. Describe in brief any type of Ensemble Learning?
Ensemble learning has many types but two more popular ensemble learning techniques are mentioned below.
Bagging
Bagging tries to implement similar learners on small sample populations and then takes a mean of all the predictions. In generalised bagging, you can use different learners on different population. As you expect this helps us to reduce the variance error.
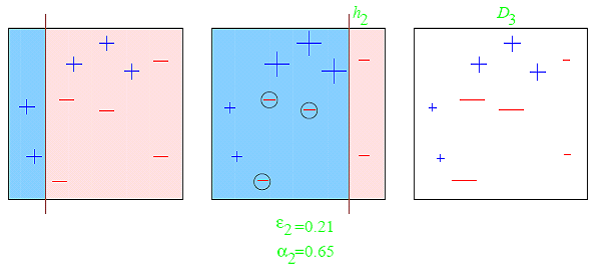
Boosting
Boosting is an iterative technique which adjusts the weight of an observation based on the last classification. If an observation was classified incorrectly, it tries to increase the weight of this observation and vice versa. Boosting in general decreases the bias error and builds strong predictive models. However, they may over fit on the training data.
Q24. What is a Random Forest? How does it work?
Random forest is a versatile machine learning method capable of performing both regression and classification tasks. It is also used for dimensionality reduction, treats missing values, outlier values. It is a type of ensemble learning method, where a group of weak models combine to form a powerful model.
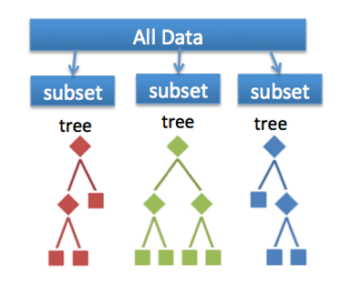 In Random Forest, we grow multiple trees as opposed to a single tree. To classify a new object based on attributes, each tree gives a classification. The forest chooses the classification having the most votes(Overall the trees in the forest) and in case of regression, it takes the average of outputs by different trees.
Q25. How Do You Work Towards a Random Forest?
The underlying principle of this technique is that several weak learners combined to provide a keen learner. The steps involved are
- Build several decision trees on bootstrapped training samples of data
- On each tree, each time a split is considered, a random sample of mm predictors is chosen as split candidates, out of all pp predictors
- Rule of thumb: At each split m=p√m=p
- Predictions: At the majority rule
Q26. What cross-validation technique would you use on a time series data set?
Instead of using k-fold cross-validation, you should be aware of the fact that a time series is not randomly distributed data — It is inherently ordered by chronological order.
In case of time series data, you should use techniques like forward=chaining — Where you will be model on past data then look at forward-facing data.
fold 1: training[1], test[2]
fold 1: training[1 2], test[3]
fold 1: training[1 2 3], test[4]
fold 1: training[1 2 3 4], test[5]
Q27. What is a Box-Cox Transformation?
The dependent variable for a regression analysis might not satisfy one or more assumptions of an ordinary least squares regression. The residuals could either curve as the prediction increases or follow the skewed distribution. In such scenarios, it is necessary to transform the response variable so that the data meets the required assumptions. A Box cox transformation is a statistical technique to transform non-normal dependent variables into a normal shape. If the given data is not normal then most of the statistical techniques assume normality. Applying a box cox transformation means that you can run a broader number of tests.
A Box-Cox transformation is a way to transform non-normal dependent variables into a normal shape. Normality is an important assumption for many statistical techniques, if your data isn’t normal, applying a Box-Cox means that you are able to run a broader number of tests. The Box-Cox transformation is named after statisticians George Box and Sir David Roxbee Cox who collaborated on a 1964 paper and developed the technique.
Q28. How Regularly Must an Algorithm be Updated?
You will want to update an algorithm when:
- You want the model to evolve as data streams through infrastructure
- The underlying data source is changing
- There is a case of non-stationarity
- The algorithm underperforms/ results lack accuracy
Q29. If you are having 4GB RAM in your machine and you want to train your model on 10GB data set. How would you go about this problem? Have you ever faced this kind of problem in your machine learning/data science experience so far?
First of all, you have to ask which ML model you want to train.
For Neural networks: Batch size with Numpy array will work.
Steps:
- Load the whole data in the Numpy array. Numpy array has a property to create a mapping of the complete data set, it doesn’t load complete data set in memory.
- You can pass an index to Numpy array to get required data.
- Use this data to pass to the Neural network.
- Have a small batch size.
For SVM: Partial fit will work
Steps:
- Divide one big data set in small size data sets.
- Use a partial fit method of SVM, it requires a subset of the complete data set.
- Repeat step 2 for other subsets.
Reference : Thanks to Edureka for an awesome collection
Comments
Post a Comment