1) What are the differences between supervised and unsupervised learning?
Supervised Learning
|
Unsupervised Learning
|
|---|---|
|
|
2) How is logistic regression done?
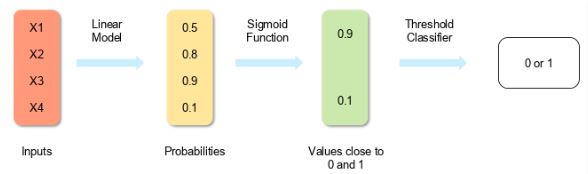
Logistic regression measures the relationship between the dependent variable (our label of what we want to predict) and one or more independent variables (our features) by estimating probability using its underlying logistic function (sigmoid).
The image shown below depicts how logistic regression works:
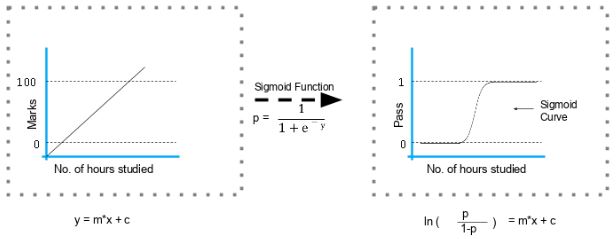
The formula and graph for the sigmoid function is as shown:
3) Explain the steps in making a decision tree.
- Take the entire data set as input
- Calculate entropy of the target variable, as well as the predictor attributes
- Calculate your information gain of all attributes (we gain information on sorting different objects from each other)
- Choose the attribute with the highest information gain as the root node
- Repeat the same procedure on every branch until the decision node of each branch is finalized
For example, let’s say you want to build a decision tree to decide whether you should accept or decline a job offer. The decision tree for this case is as shown:
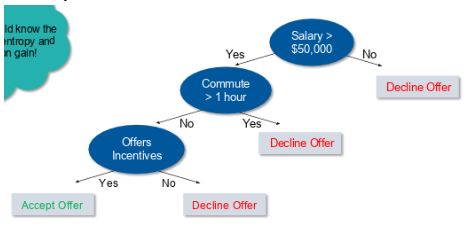
It is clear from the decision tree that an offer is accepted if:
- Salary is greater than $50,000
- The commute is less than an hour
- Incentives are offered
4) How do you build a random forest model?
A random forest is built up of a number of decision trees. If you split the data into different packages and make a decision tree in each of the different groups of data, the random forest brings all those trees together.
Steps to build a random forest model:
- Randomly select ‘k’ features from a total of ‘m’ features where k << m
- Among the ‘k’ features, calculate the node D using the best split point
- Split the node into daughter nodes using the best split
- Repeat steps two and three until leaf nodes are finalized
- Build forest by repeating steps one to four for ‘n’ times to create ‘n’ number of trees
5) How can you avoid the overfitting of your model?
Overfitting refers to a model that is only set for a very small amount of data and ignores the bigger picture. There are three main methods to avoid overfitting:
- Keep the model simple—take fewer variables into account, thereby removing some of the noise in the training data
- Use cross-validation techniques, such as k folds cross-validation
- Use regularization techniques, such as LASSO, that penalize certain model parameters if they're likely to cause overfitting
6) Differentiate between univariate, bivariate, and multivariate analysis.
Univariate
Univariate data contains only one variable. The purpose of the univariate analysis is to describe the data and find patterns that exist within it.
Example: height of students
Height (in cm)
|
164
|
167.3
|
170
|
174.2
|
178
|
180
|
The patterns can be studied by drawing conclusions using mean, median, mode, dispersion or range, minimum, maximum, etc.
Bivariate
Bivariate data involves two different variables. The analysis of this type of data deals with causes and relationships and the analysis is done to determine the relationship between the two variables.
Example: temperature and ice cream sales in the summer season
Temperature (in Celcius)
|
Sales
|
20
|
2,000
|
25
|
2,100
|
26
|
2,300
|
28
|
2,400
|
30
|
2,600
|
36
|
3,100
|
Here, the relationship is visible from the table that temperature and sales are directly proportional to each other. The hotter the temperature, the better the sales.
Multivariate
Multivariate data involves three or more variables, it is categorized under multivariate. It is similar to a bivariate, but contains more than one dependent variable.
Example: data for house price prediction
No. of rooms
|
Floors
|
Area (sq ft)
|
Price
|
2
|
0
|
900
|
$4000,00
|
3
|
2
|
1,100
|
$600,000
|
3.5
|
5
|
1,500
|
$900,000
|
4
|
3
|
2,100
|
$1,200,000
|
The patterns can be studied by drawing conclusions using mean, median, and mode, dispersion or range, minimum, maximum, etc. You can start describing the data and using it to guess what the price of the house will be.
7) What are the feature selection methods used to select the right variables?
There are two main methods for feature selection:
Filter Methods
This involves:
- Linear discrimination analysis
- ANOVA
- Chi-Square
The best analogy for selecting features is “bad data in, bad answer out.” When we're limiting or selecting the features, it's all about cleaning up the data coming in.
Wrapper Methods
This involves:
- Forward Selection: We test one feature at a time and keep adding them until we get a good fit
- Backward Selection: We test all the features and start removing them to see what works better
- Recursive Feature Elimination: Recursively looks through all the different features and how they pair together
Wrapper methods are very labor-intensive, and high-end computers are needed if a lot of data analysis is performed with the wrapper method.
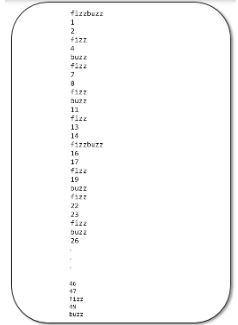
8) In your choice of language, write a program that prints the numbers ranging from one to 50.
But for multiples of three, print “Fizz” instead of the number and for the multiples of five, print “Buzz.” For numbers which are multiples of both three and five, print “FizzBuzz”
The code is shown below:
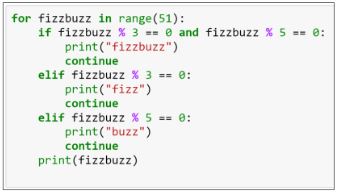
Note that the range mentioned is 51, which means zero to 50. However, the range asked in the question is one to 50. Therefore, in the above code, you can include the range as (1,51).
The output of the above code is as shown:
9) You are given a data set consisting of variables with more than 30 percent missing values. How will you deal with them?
The following are ways to handle missing data values:
If the data set is large, we can just simply remove the rows with missing data values. It is the quickest way; we use the rest of the data to predict the values.
For smaller data sets, we can substitute missing values with the mean or average of the rest of the data using pandas dataframe in python. There are different ways to do so, such as df.mean(), df.fillna(mean).
10) For the given points, how will you calculate the Euclidean distance in Python?
plot1 = [1,3]
plot2 = [2,5]
The Euclidean distance can be calculated as follows:
euclidean_distance = sqrt( (plot1[0]-plot2[0])**2 + (plot1[1]-plot2[1])**2 )
11) What is dimensionality reduction and its benefits?
Dimensionality reduction refers to the process of converting a data set with vast dimensions into data with fewer dimensions (fields) to convey similar information concisely.
This reduction helps in compressing data and reducing storage space. It also reduces computation time as fewer dimensions lead to less computing. It removes redundant features; for example, there's no point in storing a value in two different units (meters and inches).
12) How will you calculate eigenvalues and eigenvectors of the following 3x3 matrix?
-2
|
-4
|
2
|
-2
|
1
|
2
|
4
|
2
|
5
|
The characteristic equation is as shown:
Expanding determinant:
(-2 – λ) [(1-λ) (5-λ)-2x2] + 4[(-2) x (5-λ) -4x2] + 2[(-2) x 2-4(1-λ)] =0
- λ3 + 4λ2 + 27λ – 90 = 0,
λ3 - 4 λ2 -27 λ + 90 = 0
Here we have an algebraic equation built from the eigenvectors.
By hit and trial:
33 – 4 x 32 - 27 x 3 +90 = 0
Hence, (λ - 3) is a factor:
λ3 - 4 λ2 - 27 λ +90 = (λ – 3) (λ2 – λ – 30)
Eigenvalues are 3,-5,6:
(λ – 3) (λ2 – λ – 30) = (λ – 3) (λ+5) (λ-6),
Calculate eigenvector for λ = 3
For X = 1,
-5 - 4Y + 2Z =0,
-2 - 2Y + 2Z =0
Subtracting the two equations:
3 + 2Y = 0,
Subtracting back into second equation:
Y = -(3/2)
Z = -(1/2)
Similarly, we can calculate the eigenvectors for -5 and 6.
13) How should you maintain a deployed model?
The steps to maintain a deployed model are:
Monitor
Constant monitoring of all models is needed to determine their performance accuracy. When you change something, you want to figure out how your changes are going to affect things. This needs to be monitored to ensure it's doing what it's supposed to do.
Evaluate
Evaluation metrics of the current model are calculated to determine if a new algorithm is needed.
Compare
The new models are compared to each other to determine which model performs the best.
Rebuild
The best performing model is re-built on the current state of data.
14) What are recommender systems?
A recommender system predicts what a user would rate a specific product based on their preferences. It can be split into two different areas:
Collaborative filtering
As an example, Last.fm recommends tracks that other users with similar interests play often. This is also commonly seen on Amazon after making a purchase; customers may notice the following message accompanied by product recommendations: “Users who bought this also bought…”
Content-based filtering
As an example: Pandora uses the properties of a song to recommend music with similar properties. Here, we look at content, instead of looking at who else is listening to music.
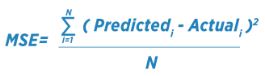
15) How do you find RMSE and MSE in a linear regression model?
RMSE and MSE are two of the most common measures of accuracy for a linear regression model.
RMSE indicates the Root Mean Square Error.
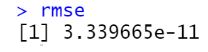
MSE indicates the Mean Square Error.
16) How can you select k for k-means?
We use the elbow method to select k for k-means clustering. The idea of the elbow method is to run k-means clustering on the data set where ‘k’ is the number of clusters.
Within the sum of squares (WSS), it is defined as the sum of the squared distance between each member of the cluster and its centroid.
17) What is the significance of p-value?
p-value typically ≤ 0.05
This indicates strong evidence against the null hypothesis; so you reject the null hypothesis.
p-value typically > 0.05
This indicates weak evidence against the null hypothesis, so you accept the null hypothesis.
p-value at cutoff 0.05
This is considered to be marginal, meaning it could go either way.
18) How can outlier values be treated?
You can drop outliers only if it is a garbage value.
Example: height of an adult = abc ft. This cannot be true, as the height cannot be a string value. In this case, outliers can be removed.
If the outliers have extreme values, they can be removed. For example, if all the data points are clustered between zero to 10, but one point lies at 100, then we can remove this point.
If you cannot drop outliers, you can try the following:
- Try a different model. Data detected as outliers by linear models can be fit by nonlinear models. Therefore, be sure you are choosing the correct model.
- Try normalizing the data. This way, the extreme data points are pulled to a similar range.
- You can use algorithms that are less affected by outliers; an example would be random forests.
19) How can a time-series data be declared as stationary?
It is stationary when the variance and mean of the series are constant with time.
Here is a visual example:
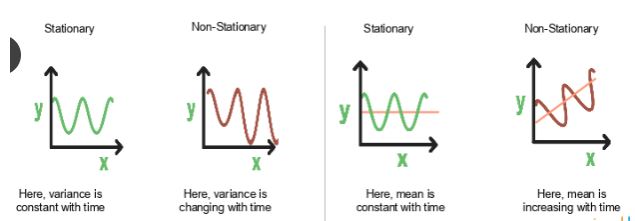
In the first graph, the variance is constant with time. Here, X is the time factor and Y is the variable. The value of Y goes through the same points all the time; in other words, it is stationary.
In the second graph, the waves get bigger, which means it is non-stationary and the variance is changing with time.
20) How can you calculate accuracy using a confusion matrix?
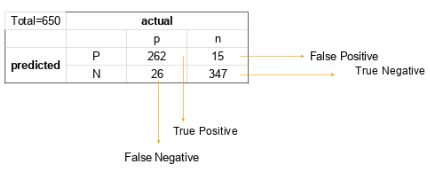
Consider this confusion matrix:
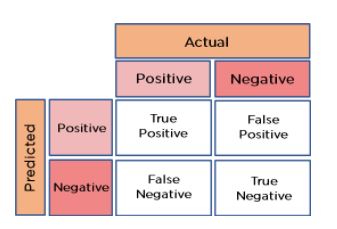
You can see the values for total data, actual values, and predicted values.
The formula for accuracy is:
Accuracy = (True Positive + True Negative) / Total Observations
= (262 + 347) / 650
= 609 / 650
= 0.93
As a result, we get an accuracy of 93 percent.
21) Write the equation and calculate the precision and recall rate.
Consider the same confusion matrix used in the previous question.
Precision = (True positive) / (True Positive + False Positive)
= 262 / 277
= 0.94
Recall Rate = (True Positive) / (Total Positive + False Negative)
= 262 / 288
= 0.90
22) ‘People who bought this also bought…’ recommendations seen on Amazon are a result of which algorithm?
The recommendation engine is accomplished with collaborative filtering. Collaborative filtering explains the behavior of other users and their purchase history in terms of ratings, selection, etc.
The engine makes predictions on what might interest a person based on the preferences of other users. In this algorithm, item features are unknown.
For example, a sales page shows that a certain number of people buy a new phone and also buy tempered glass at the same time. Next time, when a person buys a phone, he or she may see a recommendation to buy tempered glass as well.
23) Write a basic SQL query that lists all orders with customer information.
Usually, we have order tables and customer tables that contain the following columns:
Order Table
Orderid
customerId
OrderNumber
TotalAmount
Customer Table
Id
FirstName
LastName
City
Country
The SQL query is:
SELECT OrderNumber, TotalAmount, FirstName, LastName, City, Country
FROM Order
JOIN Customer
ON Order.CustomerId = Customer.Id
24) You are given a dataset on cancer detection. You have built a classification model and achieved an accuracy of 96 percent. Why shouldn't you be happy with your model performance? What can you do about it?
Cancer detection results in imbalanced data. In an imbalanced dataset, accuracy should not be based as a measure of performance. It is important to focus on the remaining four percent, which represents the patients who were wrongly diagnosed. Early diagnosis is crucial when it comes to cancer detection, and can greatly improve a patient’s prognosis.
Hence, to evaluate model performance, we should use Sensitivity (True Positive Rate), Specificity (True Negative Rate), F measure to determine the class wise performance of the classifier.
25) Which of the following machine learning algorithms can be used for inputting missing values of both categorical and continuous variables?
- K-means clustering
- Linear regression
- K-NN (k-nearest neighbor)
- Decision trees
The K nearest neighbor algorithm can be used because it can compute the nearest neighbor and if it doesn't have a value, it just computes the nearest neighbor based on all the other features.
When you're dealing with K-means clustering or linear regression, you need to do that in your pre-processing, otherwise, they'll crash. Decision trees also have the same problem, although there is some variance.
26) Below are the eight actual values of the target variable in the train file. What is the entropy of the target variable?
[0, 0, 0, 1, 1, 1, 1, 1]
Choose the correct answer.
- -(5/8 log(5/8) + 3/8 log(3/8))
- 5/8 log(5/8) + 3/8 log(3/8)
- 3/8 log(5/8) + 5/8 log(3/8)
- 5/8 log(3/8) – 3/8 log(5/8)
The target variable, in this case, is 1.
The formula for calculating the entropy is:
Putting p=5 and n=8, we get
Entropy = A = -(5/8 log(5/8) + 3/8 log(3/8))
27) We want to predict the probability of death from heart disease based on three risk factors: age, gender, and blood cholesterol level. What is the most appropriate algorithm for this case?
Choose the correct option:
- Logistic Regression
- Linear Regression
- K-means clustering
- Apriori algorithm
The most appropriate algorithm for this case is A, logistic regression.
28) After studying the behavior of a population, you have identified four specific individual types that are valuable to your study. You would like to find all users who are most similar to each individual type. Which algorithm is most appropriate for this study?
Choose the correct option:
- K-means clustering
- Linear regression
- Association rules
- Decision trees
As we are looking for grouping people together specifically by four different similarities, it indicates the value of k. Therefore, K-means clustering (answer A) is the most appropriate algorithm for this study.
29) You have run the association rules algorithm on your dataset, and the two rules {banana, apple} => {grape} and {apple, orange} => {grape} have been found to be relevant. What else must be true?
Choose the right answer:
- {banana, apple, grape, orange} must be a frequent itemset
- {banana, apple} => {orange} must be a relevant rule
- {grape} => {banana, apple} must be a relevant rule
- {grape, apple} must be a frequent itemset
The answer is A: {grape, apple} must be a frequent itemset
30) Your organization has a website where visitors randomly receive one of two coupons. It is also possible that visitors to the website will not receive a coupon. You have been asked to determine if offering a coupon to website visitors has any impact on their purchase decisions. Which analysis method should you use?
- One-way ANOVA
- K-means clustering
- Association rules
- Student’s t-test
The answer is A: One-way ANOVA
Additional Questions on Basic Data Science Concepts
31. What are the feature vectors?
A feature vector is an n-dimensional vector of numerical features that represent an object. In machine learning, feature vectors are used to represent numeric or symbolic characteristics (called features) of an object in a mathematical way that’s easy to analyze.
32. What are the steps in making a decision tree?
- Take the entire data set as input.
- Look for a split that maximizes the separation of the classes. A split is any test that divides the data into two sets.
- Apply the split to the input data (divide step).
- Re-apply steps one and two to the divided data.
- Stop when you meet any stopping criteria.
- This step is called pruning. Clean up the tree if you went too far doing splits.
33. What is root cause analysis?
Root cause analysis was initially developed to analyze industrial accidents but is now widely used in other areas. It is a problem-solving technique used for isolating the root causes of faults or problems. A factor is called a root cause if its deduction from the problem-fault-sequence averts the final undesirable event from recurring.
34. What is logistic regression?
Logistic regression is also known as the logit model. It is a technique used to forecast the binary outcome from a linear combination of predictor variables.
35. What are recommender systems?
Recommender systems are a subclass of information filtering systems that are meant to predict the preferences or ratings that a user would give to a product.
36. Explain cross-validation.
Cross-validation is a model validation technique for evaluating how the outcomes of a statistical analysis will generalize to an independent data set. It is mainly used in backgrounds where the objective is to forecast and one wants to estimate how accurately a model will accomplish in practice.
The goal of cross-validation is to term a data set to test the model in the training phase (i.e. validation data set) to limit problems like overfitting and gain insight into how the model will generalize to an independent data set.
37. What is collaborative filtering?
Most recommender systems use this filtering process to find patterns and information by collaborating perspectives, numerous data sources, and several agents.
38. Do gradient descent methods always converge to similar points?
They do not, because in some cases, they reach a local minima or a local optima point. You would not reach the global optima point. This is governed by the data and the starting conditions.
39. What is the goal of A/B Testing?
This is statistical hypothesis testing for randomized experiments with two variables, A and B. The objective of A/B testing is to detect any changes to a web page to maximize or increase the outcome of a strategy.
40. What are the drawbacks of the linear model?
- The assumption of linearity of the errors
- It can’t be used for count outcomes or binary outcomes
- There are overfitting problems that it can’t solve
41. What is the law of large numbers?
It is a theorem that describes the result of performing the same experiment very frequently. This theorem forms the basis of frequency-style thinking. It states that the sample mean, sample variance and sample standard deviation converge to what they are trying to estimate.
42. What are the confounding variables?
These are extraneous variables in a statistical model that correlates directly or inversely with both the dependent and the independent variable. The estimate fails to account for the confounding factor.
43. What is star schema?
It is a traditional database schema with a central table. Satellite tables map IDs to physical names or descriptions and can be connected to the central fact table using the ID fields; these tables are known as lookup tables and are principally useful in real-time applications, as they save a lot of memory. Sometimes, star schemas involve several layers of summarization to recover information faster.
44. How regularly must an algorithm be updated?
You will want to update an algorithm when:
- You want the model to evolve as data streams through infrastructure
- The underlying data source is changing
- There is a case of non-stationarity
45. What are eigenvalue and eigenvector?
Eigenvalues are the directions along which a particular linear transformation acts by flipping, compressing, or stretching.
Eigenvectors are for understanding linear transformations. In data analysis, we usually calculate the eigenvectors for a correlation or covariance matrix.
46. Why is resampling done?
Resampling is done in any of these cases:
- Estimating the accuracy of sample statistics by using subsets of accessible data, or drawing randomly with replacement from a set of data points
- Substituting labels on data points when performing significance tests
- Validating models by using random subsets (bootstrapping, cross-validation)
47. What is selection bias?
Selection bias, in general, is a problematic situation in which error is introduced due to a non-random population sample.
48. What are the types of biases that can occur during sampling?
- Selection bias
- Undercoverage bias
- Survivorship bias
49. What is survivorship bias?
Survivorship bias is the logical error of focusing aspects that support surviving a process and casually overlooking those that did not because of their lack of prominence. This can lead to wrong conclusions in numerous ways.
50. How do you work towards a random forest?
The underlying principle of this technique is that several weak learners combine to provide a strong learner. The steps involved are:
- Build several decision trees on bootstrapped training samples of data
- On each tree, each time a split is considered, a random sample of mm predictors is chosen as split candidates out of all pp predictors
- Rule of thumb: At each split m=p√m=p
- Predictions: At the majority rule
Reference : Thanks to Simplilearn for an awesome Collection of Data Science Interview Questions
Comments
Post a Comment